Dr hab. Ryszard Glazik, NCU professor
Dr Katarzyna Kubiak-Wójcicka
Nicolaus Copernicus University
Institute of Geography
Department of Hydrology and Water Management
ul. Gagarina 9
87-100 Toruń
Poland
e-mail: kubiak@geo.uni.torun.pl
Floods on the Vistula in Toruń in the years 1951-2000
Introduction
The Vistula is the longest river in
Poland, with a total length of 1,047.5 km. The surface area of the drainage
basin covers 194,424.4 km2, 86.8 % of which lies within the borders
of Poland (Stachy, 1986). The mean discharge of the Vistula in the years
1951-2000 on the stretch at the river mouth was 1,074 m3.s-1.
The Vistula can be divided into three characteristic sections: the upper
section from its sources to the mouth of the River San, the middle section from
the mouth of the San to the mouth of the River Narew, and the lower section
from the mouth of the Narew to the mouth of the Vistula where it debouches into
the sea (fig. 1).
The lower section of the Vistula
measures 391 km (Cyberski, 1982). It is diverse as far as its regulation and
hydrotechnical constructions are concerned. On the section from the mouth of
the Narew to Silno, the Vistula was left for many years in its natural state,
while the section from Silno to the mouth of the river was completely regulated
in the 19th century. Nowadays the lower section of the Vistula can
be divided into four characteristic sections:
-
from the
mouth of the Narew to Płock, unregulated,
-
from
Płock to Włocławek. As a result of building a dam across the
Vistula at 674.8 km, a reservoir was created with a capacity of
408 mln m3 and a surface area of 70 km2. The
installed power of the hydroelectric power plant is 162 MW. The dam in
Włocławek was constructed in 1962-1970 (Glazik, 1978).
-
from
Włocławek to Silno, partially regulated section, considerably
affected by the operation of the hydroelectric power plant in
Włocławek,
-
from Silno
to the mouth of the river, the most regulated section of the Vistula.
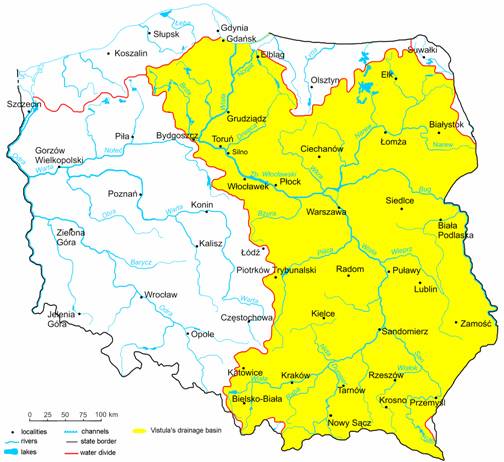
Fig. 1. Network of waterways in Poland
The valley of the lower Vistula
displays great geomorphological diversity. Widening in the form of basins and
narrowing occur alternately in the valley. The width of the Vistula flood plain
is from 650 m to 4,000 m.
Aim and scope of the paper
The aim of the paper is to
characterise the water levels of the Vistula in Toruń during the period
1951-2000 with particular attention paid to floods. The extreme phenomena of
floods are particularly relevant to the inhabitants of riverside areas.
The choice of the hydrometric station
in Toruń results from the fact that hydrological observations on the
Vistula have been carried out since as early as 1760, though Z. Mikulski (1962)
believes them to have begun even earlier. According to J. Makowski and A.
Tomczak (2002), uninterrupted daily observations of water levels have been carried
out on the Vistula in Toruń since 1817 until the present day. This is the
longest observational period in Poland.
Data were obtained from the Vistula
Hydrological Annals (1950-1983) and from the Regional Water Management Board in
Toruń (1984-2000). The maximum water levels that occurred in
historical times were taken into account in this paper as well as those during
the 50 years under analysis. On the basis of the daily water levels of the
Vistula at the station in Toruń, periods when floods occurred during the
hydrological years 1951-2000 were determined. Floods are treated as extreme
phenomena, and thus will not occur every year. A flood was taken as being a
water level that was higher than or equal to the mean high water (SWW) from the
period 1951-2000 and lasted at least 5 consecutive days.
Historical observations of water levels in Toruń
Before systematic observations of
water levels were undertaken, high-water marks were used, fixed to the walls of
important buildings. In Toruń, such marks were placed on the Bridge Gate
and on the walls of the old town near the river. The highest, and at the same
time the oldest, water level of the Vistula in Toruń comes from 18
February 1570. It came to 1074 cm, meaning that the water reached a height of
42.7 m above sea level. The second high level recorded on the walls of the town
comes from 17 February 1584. The water level then was 1,056 cm (42.52 m above
sea level). The next flood recorded with a high-water mark comes from 16 March
1719 and reached 1021 cm (42.17 m above sea level).
During the period when measurements
of the water level have been taken, the absolute maximum took place on 1 March
1871 and reached 979 cm (ordinate 41.78 m above sea level). According to J.
Makowski and A. Tomczak (2002), the maximum discharge was then 9,250 m3.s-1,
which gave a unitary outflow of about 51 l.s-1.km-2.
On the other hand, the absolute minimum occurred on 1 December 1892 and reached
110 cm (33.06 m above sea level). The amplitude was 869 cm and is one of the
highest in Poland. High amplitude values on the lower Vistula are a result of a
narrowing of the flood plain through the building of flood embankments.
The hydrometric station in Toruń
is located at the 734.7th km of the course of the river. Gauge zero
is 31.981 m above sea level in Kronstadt. The gauge closes a basin with a
surface area of 181,033 km2, which constitutes 93.11 % of the total
surface area of the Vistula drainage basin.
The location of the hydrometric
station, measurements on hydrometric rods and gauge zero changed several times
during the 19th and 20th centuries. In the analysed
period of 1951-2000 gauge zero underwent a change. From 1966, these changes
were the consequence of referring levelling to the sea level in Kronstadt.
Until 1966 gauge zero had referred to the sea level in Amsterdam (Normal Null)
(Hydrological Annals, 1966). Hydrological data are comparable because gauge
zero in Kronstadt takes into account a correction for the ordinate of sea level
in Amsterdam.
Regulation of the Vistula
Hydrographic relations in the area
being researched have undergone a great anthropogenic transformation due to the
long-term work on the regulation of the Vistula and the sections at the mouths
of its tributaries. Until the middle of the 19th century, regulation
of the Vistula in the region of Toruń was mainly based on the construction
of flood embankments and dredging the river. This type of work was, however,
local in nature and was not a systematic regulation of the river in the modern
meaning. Comprehensive regulation of the Vistula was carried out under the
Prussian partition, i.e. from the mouth of the River Tążyna (in the
environs of Silno) as far as the sea.
The aim of regulation was to ensure a
suitable depth in the river and free flow of ice in the winter. Regulation work
began in 1835, with work being accelerated only after 1855 and reaching its
greatest intensity in 1880-1892. This final stage was based on a new project
from 1879, in which, besides a correction of the directions of the route,
slight changes were introduced in the previously accepted widths of the route
from 377 m to 375 m and the route on the Silno – mouth of the River Drwęca
section from 377 m to 350 m (Czernik, 1955). The scope of work carried out and
planned is presented on regulation plans of the Vistula channel, which were
published in 1888. In a later period (to 1907), it proved necessary to build a
series of supplementary constructions, mostly additional indirect spurs
(Glazik, Kubiak-Wójcicka, 2006).
Maximum water levels on the Vistula in Toruń in the years 1951-2000
On the basis of daily values of the
water levels of the Vistula at the station in Toruń, a zone of high water
levels was determined in the period 1951-2000 (fig. 2).
Fig. 2. Maximum water levels of the Vistula in Toruń in the period 1951-2000
In the years 1951-2000 the highest
water level (WWW) reached 867 cm (12 June 1962). This corresponds to the
maximum discharge of 6,650 m3.s-1 (unitary outflow 36.7 l.s-1.km-2).
The maximum water level exceeded the mean level (SWW) by 215 cm and was 112 cm
lower than the absolute maximum from 1871. The lowest water level in the
high-water zone (NWW) happened on 12 July 1984 and reached 422 cm (fig. 2). At
the station in Toruń, the amplitude of maximum water levels was 445 cm.
The danger point (650 cm) has been exceeded 27 times in Toruń, and the
warning point (530 cm) as many as 42 times.
The highest water levels most often
occurred in March (16 years) and April (15 years) (fig. 3). These were melt
floods, often linked with the flow of ice-floes and with ice jams (Grześ,
1991). The latter can significantly affect the rise in the water levels during
the thaw.
The highest water levels in the
summer half-years most often happened in July (4 years) and August (3 years).
These were precipitation floods. Only in the month of September did high levels
of water not occur. During the 50-year period being analysed, the highest water
levels occurred as many as 38 times in the winter half-years and 12 times in
the summer half-years (fig. 3). This testifies to the decided predominance of
melt floods over rainfall floods.
Fig. 3. Frequency of occurrence over a
year of the highest water levels on the Vistula in Toruń in the years
1951-2000
On the
basis of the maximum annual water levels of the Vistula in Toruń in the
period 1951-2000, it was determined what the annual coefficients k of the
highest water levels were. This is the relation between the maximum annual
water level (WW) and the mean maximum water level from the many-year period
(SWW).
The highest values of k occurred in
1960, 1962, 1979 and 1980. The maximum water levels displayed a general
tendency to decrease. This is particularly evident after 1980. 1984 was
characterised by the lowest water level among the maximum water levels from the
entire 50-year period (fig. 4).
Fig. 4. Annual coefficients (k) of the highest water levels on the Vistula in Toruń in 1951-2000
On the basis of the cumulative of
maximum annual coefficients of the water levels of the Vistula (total k-1), two characteristic periods for
the occurrence of a rise and fall in the maximum water levels were determined
in the analysed decades. The first period lasted from 1951 to 1982 and was
characterized by a rise in the maximum water levels. During this period there
occurred brief fluctuations of water of secondary importance. After 1982, there
is a distinct tendency for the water levels to decrease, this period lasting
until 1996. The main cause of the decrease in the annual culminations of water
levels was the hydrological drought in the late 1980s and early 1990s.
Examples of hydrograms of water
levels in Toruń in the hydrological years 1962 and 1984 are presented in
fig. 5 against the background of mean annual water levels.
Fig. 5. Daily water levels of the Vistula in Toruń in 1962 and 1984
The hydrological year 1962 was
characteristic because of the highest irregularity coefficient of daily water
levels (7.2). The maximum water level occurred on 12 June and reached 867 cm.
The lowest water level occurred 20 and 21 December and reached 121 cm. The
amplitude was 746 cm. The mean water level was 347 cm. Four floods are visible
in fig. 5. The first in mid-March (melt floods), with raised water levels
holding for about two weeks. The second flood happened in April and was caused
by abundant precipitation in late March and early April and by a simultaneous
increase in temperature (melt-precipitation flood). The greatest culmination of
the flood occurred in June and was caused by increased precipitation at the
beginning of the month, which coincided with high levels of melting
(precipitation-melt flood) (Hydrological Annals, 1962). A small flood also took
place at the end of July, but lasted relatively briefly, about a week
(precipitation flood).
The lowest irregularity coefficient
of water levels in the Vistula occurred in 1984. It was merely 2.4. The maximum
water level in July (422 cm) was only about 98 cm higher than the mean water
level for the period 1951-2000. The lowest water level was recorded on 8
December at 174 cm. Daily water levels mainly remained within the 200-300 cm
range. The mean annual water level was only 256 cm and was 68 cm lower than the
mean for the many-year period (1951-2000). The 1984 hydrological year was
unusually dry. The water level amplitude was 248 cm. The daily rhythm of water
levels is significantly affected by the operation of the hydroelectric plant in
Włocławek (after 1970).
Floods and the risk of flooding
M. Ozga-Zielińska and J.
Brzeziński (1994) define a flood as a period when there occur discharges
in a river that are equal to or higher than the values of the threshold
discharge and last a certain number of days. They propose that the threshold
discharge be determined according to a hydrological criterion, in other words
that the threshold discharge is taken to be the lowest discharge value from
among maximum annual discharges (NWQ) or the mean value from annual maximums
(ZWQ). In the first case, a flood will take place every year, while in the
second case, in some years, or more precisely, in half of the observed years
floods so defined will not occur, whereas in other years they may happen
several times. It is assumed that floods are exceptional phenomena. Hence they
cannot occur every year. The water level was taken in order to define floods
because of the long period of observation. The threshold value was taken as
being the mean maximum water level (SWW) from the 1951-2000 period, which for
Toruń was 652 cm. It is close to the danger point, which is 650 cm on the
Vistula in Toruń. A flood was considered to take place when the duration
of water levels above or equal to the threshold value lasted for at least 5
days. Such a criterion allows short floods, most often 1 or 2 days long, to be
eliminated.
Depending on the different causes and
the period of occurrence, floods can be divided into summer (May-October) and
winter floods (November-April).
Tab. 1. Number of days with floods at the station in
Toruń in 1951-2000
|
|
Hydrological
year |
Number
of days with floods |
Total,
number of days with floods |
|
|
Winter
half-year |
Summer
half-year |
|||
|
1. |
1953 |
7
(27 II-5 III) |
- |
7 |
|
2. |
1958 |
20 (11
IV-30 IV) |
- |
20 |
|
3. |
1960 |
- |
6 (2 VIII-7 VIII) |
6 |
|
4. |
1962 |
10 (6
IV- 15 IV) |
7 (10 VI-16 VI) |
17 |
|
5. |
1964 |
12 (2 IV-13 IV) |
- |
12 |
|
6. |
1965 |
6 (23 III-28 III) |
- |
6 |
|
7. |
1966 |
8 (26 II-5 III) |
- |
8 |
|
8. |
1967 |
16 (5 III-20 III) |
- |
16 |
|
9. |
1970 |
13 (4 IV-16 IV) |
- |
13 |
|
10. |
1975 |
9 (4 XI-12 XI) |
- |
9 |
|
11. |
1979 |
32 (15 III-15 IV) |
- |
32 |
|
12. 13. |
1980 1980 |
- - |
7 (30 VII-5 VIII) 5 (17 X-21 X) |
12 |
|
|
1951-2000 |
133 |
25 |
158 |
In
total in the 1951-2000 period, there occurred 14 floods, including 2 summer
floods in 1980 and 1 summer and 1 winter flood in 1962 (tab. 1). After 1980,
the mean maximum water level for the Vistula in Toruń was exceeded several
times, but only lasted for 4 days, e.g. in January 1982 and April 1988. Since
these were floods that lasted less than 5 consecutive days, they are not
included in the table. Winter floods (10) predominated over summer floods (4).
During the winter half-year (November-April), there were 84 % of days with
floods, while during the summer half-year 16 %. Winter floods were
characterised by their significantly longer duration, on average 13 days. These
were mainly floods linked with the early spring run-off of melt-waters,
frequently intensified by the passing of frazil ice and ice-floes, which most
often happened in March and April (Babiński, 1982). The average date for
the appearance of melt floods was 7 March. Summer floods were short, lasting 6
days on average. They were caused by widespread summer precipitation, which
most often happened in August. The average date for the appearance of rainfall
floods was 7 August. The highest floods occurred in 1960 (844 cm), 1962 (867
cm), 1979 (810 cm) and 1980 (820 cm).
The melt flood in 1979 lasted the
longest, covering the northern part of the country. The winter of 1978/1979 was
cold and snowy. An inflow of freezing dry air at the beginning of December
caused the ground to freeze and ice to form. The thickness of the snow cover at
the end of February in the middle Vistula catchment area was about 70 cm. The
water storage in the snow cover reached 100-150 mm in central Poland and 250 mm
in north-eastern regions of the country (Fal, Bogdanowicz, 2002).
The summer flood of 1 August 1980
reached a culmination of 820 cm and was caused by exceptionally heavy
precipitation, especially in Kujawy and Pomerania. According to Z. Mikulski
(1998), about 1,400,000 hectares of arable land were submerged.
The
total duration of the floods in individual months is presented in fig. 6. In
the analysed period of 1951-2000, the floods lasted the longest in April (70
days) and March (49 days), but did not occur in December, January, May and
September.
The beginning and the end of the
appearance of floods in Toruń happens on different dates. Most often, however,
the beginning of melt floods happens at the end of February and the beginning
of March, while the end of the floods comes in mid-April.
Fig. 6. Total duration of floods on the Vistula in Toruń in 1951-2000
Within the
city limits of Toruń there is a difference in the width of the flood
plain. The narrowest part of the flood plain (about 650 m) lies on the line of
the old town, near the hydrometric station (734.7 km). The Vistula’s flood
plain extends, without flood embankments, on the left bank only. In the event
of a flood, it is the area on the left bank that is particularly at risk.
The River
Drwęca flows into the Vistula at the 728.4 km point. The width of the
flood plain here is about 1320 m. This area is not protected with flood
embankments. In the event of a flood, it is the areas lying on the right bank
(houses and residential estates) and on the left bank (allotments) that are
especially at risk. The widest part of the flood plain is in the vicinity of
the timber port in Toruń (742 km). It is about 3520 m wide. After the
construction of flood embankments on the right and left banks of the Vistula,
the width of the flood plain between the embankments is now 1140 m. The
embankments protect residential buildings and allotments on the right bank and
the village of Wielka Nieszawka on the left bank. In the event of a flood
similar to the one from 1 March 1871, the flood embankments would not be
sufficient to protect the threatened areas.
Conclusions
On the
basis of the daily values of water levels of the Vistula in Toruń in the
period 1951-2000, the maximum water levels that occurred each year were
determined. During those 50 years, more maximums happened in the winter
half-year (38 years) than in the summer half (12 years). The highest maximum
water level occurred on 12 June 1962 at 867 cm. It exceeded the danger point
(650 cm) by 217 cm and was 112 cm lower than the absolute maximum from 1871.
The oldest and the highest water level of the Vistula marked on the town walls
from 18 February 1570 (1074 cm) was 207 cm higher than the maximum water level
from 1951-2000. The lowest water level in the high level zone occurred on 12
July 1984, coming to 422 cm. During those 50 years the danger point in
Toruń has been exceeded 27 times, and the warning point (530 cm) as many
as 42 times. However, a downward trend in the maximum water levels has been
noticed. This is particularly distinct after 1984 as an effect of the
hydrological drought in the late 1980s and early 1990s.
A flood is
treated as an exceptional phenomenon, meaning that it will not happen every
year. The threshold value of a flood was taken as
being the mean maximum water level from the 1951-2000 period, which was 652 cm.
A flood was taken as being a water level which was equal to or higher than 652
cm and lasted at least 5 consecutive days. In total during the 1951-2000 period
there were 14 floods, of which 10 occurred in the winter half-year and 4 in the
summer half. Winter floods (melt floods) were characterised by a longer
duration – on average 13 days. They were often intensified by the passing of
frazil ice and ice-floes. Summer floods (rainfall floods) were considerably
shorter – on average 6 days. Since 1980, the mean maximum water level has been
exceeded several times, but lasted for less than 5 consecutive days.
The water
level in Toruń is affected by the operation of the dam in
Włocławek and the regulation work carried out in the 19th
century.
References
Babiński Z., 1982, Procesy korytowe Wisły
poniżej zapory we Włocławku, Dok. Geogr. IGiPZ PAN, 1-2
Cyberski J., 1982, Charakterystyka hydrologiczna,
(in:) B. Augustowski (edit.), Dolina dolnej Wisły, Ossolineum, 103-153
Czernik S., 1955, Zagadnienie regulacji Wisły
dolnej, Gosp. Wodna, 3, 116-122
Fal B., Bogdanowicz E., 2002, Zasoby wód
powierzchniowych Polski, Wiad. IMGW, 2, 3-38
Glazik R., 1978, Wpływ zbiornika wodnego na
Wiśle we Włocławku na zmiany stosunków wodnych w dolinie,
Dok. Geogr. IGiPZ PAN, 2-3
Glazik R., Kubiak-Wójcicka K., 2006, Wody
powierzchniowe, (w:) Toruń i jego okolice. Monografia przyrodnicza,
Wydawnictwo UMK, Toruń, 129-152
Grześ M., 1991, Zatory i powodzie zatorowe na
dolnej Wiśle. Mechanizmy i warunki, IGiPZ PAN, Warszawa
Makowski J. Tomczak A., 2002, Stany wody Wisły w
Toruniu w świetle pomiarów z ostatnich dwóch stuleci,
TNT, Toruń
Mikulski Z., 1957, Charakterystyka powodzi w Polsce,
Gosp. Wodna, 9, 424-428
- 1962,
Występowanie niżówek, wezbrań i powodzi w rzekach
polskich, Wiad. Służby Hydrol. i Meteor., 49, 3-23
- 1998,
Gospodarka wodna, PWN, Warszawa
Ozga-Zielińska M., Brzeziński J., 1994,
Hydrologia stosowana, PWN, Warszawa
Rocznik hydrologiczny Wisły wód
powierzchniowych. Dorzecze Wisły i rzeki Przymorza na wschód od
Wisły, 1950-1983, PIHM, Wyd. Komun. i Łączności
Stachy J. (edit.), 1986, Atlas hydrologiczny Polski,
Metoda opracowania i zestawienia liczbowe, Tom II, z.1., Wyd. Geol., Warszawa