PhD Mouchkaev A.S.*, DSc. L'vov
A.A., PhD L'vov P.A., and Matoshko I.M.
*Korea Advanced Institute of Science
and Technology, Daejeon, South Korea
Saratov State Technical University named after Gagarin
J.A., Saratov, Russia
Radio Frequency
Identification using Multi-port Junction
Radio frequency identification (RFID) system is a
wireless communication system in which the radio link between the base station
(reader) and the transponders is provided by the modulated backscattered waves.
The reader sends information to one or
more transponders by amplitude-shift keying (ASK) modulating an RF carrier. The transponder responds by ASK/PSK (phase-shift
keying) modulating the impedance placed on the antenna terminals. In doing so,
it backscatters an information signal to the reader. The read/write range performance of a RFID system depends mainly
on the choice of frequency, radiated power from the reader, sensitivity and
modulation efficiency of a transponder, data rate, reader receiver sensitivity
in the presence of self-jammer signal and location of the transponder [1].
The biggest challenge for the receiver front-end is to
handle leakage from the full power continuous wave (CW) signal being
transmitted during reception to keep the passive transponders powered up. This calls for the design of a wide dynamic
range receiver or a use of some sort of an isolation approach, or self-jammer
cancellation technique. However, the
isolation between transmitting and receiving channels increases the RFID reader
cost. Leakage canceller complicates the
reader receiver and adds to the reader’s consumption that is critical for
mobile applications.
In this paper, a new demodulation method is proposed which
utilizes the leakage signal instead of its canceling. The method is based on the multi-port
reflectometer direct conversion technique and allows estimating phase of the
received signal with respect to the phase of transmitting CW signal (Fig.1).
The multi-port reflectometer is a measurement device
that allows measuring both the amplitude ratio and the phase difference of two
electromagnetic waves [2]. The use of this device in RFID reader receiver is
justified as the multi-port reflectometer measures the so-called complex
reflection coefficient of a device under test (transponder), i.e. the ratio of
the wave reflected by the transponder to the wave incident to the transponder. Therefore, both amplitude and phase
information can be estimated. In the multi-port
reflectometer, information of phase is obtained by making only power measurements
of several different linear combinations of the two electromagnetic waves (reference
and backscattered). This means that a multi-port
reflectometer is a passive linear circuit with two input ports and N ≥ 4 output (measuring) ports,
which provides at its outputs N different
linear combinations of the waves present at its inputs [2].
Fig.1. A is antenna;
A1, A2 are amplifiers; DC is directional coupler; D1,...DN
are detectors;
DAB is data acquisition board; PC is personal computer.
Consider the system model of the multi-port circuit
two input ports of which connected to transmitted and coupled ports of a
directional coupler. The multi-port
circuit performs additive direct conversion of input mixture signals containing
the signal backscattered by the transponder and the leakage signal from the
transmitter. Digitized signal![]() at i-th power sensor (detector) output is represented by the
following model [3]:
at i-th power sensor (detector) output is represented by the
following model [3]:
![]() ,
, ![]() , (1)
, (1)
where ![]() are complex gains of
i-th sensor;
are complex gains of
i-th sensor; ![]() are k-th samples of
complex amplitudes of the leakage and the received signal, respectively;
are k-th samples of
complex amplitudes of the leakage and the received signal, respectively; ![]() is k-th sample of additive
white Gaussian noise at i-th sensor, N
is the number of measuring ports. The
complex gains
is k-th sample of additive
white Gaussian noise at i-th sensor, N
is the number of measuring ports. The
complex gains ![]() of the power sensors are
unknown and entitled to be found. The
complex amplitudes
of the power sensors are
unknown and entitled to be found. The
complex amplitudes ![]() are unknown as well,
however, in our case we need to estimate the relative phase
are unknown as well,
however, in our case we need to estimate the relative phase ![]() between named complex
waves at time moment k. We assume that
between named complex
waves at time moment k. We assume that ![]() are constant during
the transponder response, but the complex amplitude
are constant during
the transponder response, but the complex amplitude ![]() and
and ![]() vary as there are short-term
frequency variation and frequency drift of the transponder signal resulting in
phase variation [1]. The equation (1)
can be expressed as
vary as there are short-term
frequency variation and frequency drift of the transponder signal resulting in
phase variation [1]. The equation (1)
can be expressed as
![]() , (2)
, (2)
where ![]() is the phase angle
between
is the phase angle
between ![]() and
and ![]() .
.
First,
bearing in mind physical properties of signals ![]() and
and ![]() we simplify (2). Since the backscattered signal
is much weaker than the leakage, i.e.
we simplify (2). Since the backscattered signal
is much weaker than the leakage, i.e. ![]() , the second term in (2) can be neglected:
, the second term in (2) can be neglected:
![]() , (3)
, (3)
The
second assumption is that the sample size at every multi-port output K is rather large (gross sample). Averaging ![]() for each sensor in (3)
(it can be done during preamble of the received signal after bit synchronization
[5]) results in
for each sensor in (3)
(it can be done during preamble of the received signal after bit synchronization
[5]) results in
 ,
, ![]() , (4)
, (4)
since a sum harmonic
series with random phase tends to zero, provided K is large enough. Then, after
the next transformation
 ,
, ![]() , (5)
, (5)
the set of equations (3)
can be written as
![]() ,
, ![]() , (6)
, (6)
where ![]() .
.
After the
following variable substitution:
![]() , (7)
, (7)
the set (6) can be represented
as:
![]() ,
, ![]() . (8)
. (8)
The estimates
of unknown parameters ![]() can be found by
the maximum likelihood (ML) method [6]. The assumption of Gaussian distribution of measuring errors
can be found by
the maximum likelihood (ML) method [6]. The assumption of Gaussian distribution of measuring errors ![]() is quite natural,
because they occur largely due to the shot noise of the power sensors and
thermal noise of the DAB amplifiers.
Hence, the values of
is quite natural,
because they occur largely due to the shot noise of the power sensors and
thermal noise of the DAB amplifiers.
Hence, the values of ![]() have the same
distribution as well. Therefore, the ML
estimates of the parameters under consideration is obtained by solving the
nonlinear least squares problem [6]:
have the same
distribution as well. Therefore, the ML
estimates of the parameters under consideration is obtained by solving the
nonlinear least squares problem [6]:
 (9)
(9)
where ![]() is the data matrix (K×N) containing the values
is the data matrix (K×N) containing the values ![]() from (5);
from (5); ![]() and
and ![]() are vectors of the
size K and N containing the values
are vectors of the
size K and N containing the values ![]() and
and ![]() from (7) respectively;
operators Tr and T
designate the trace of matrix and the transpose matrix respectively.
from (7) respectively;
operators Tr and T
designate the trace of matrix and the transpose matrix respectively.
It is shown [6]
that the solution of problem (9), i.e. vectors ![]() delivering the
global minimum to Q, should have the
following form
delivering the
global minimum to Q, should have the
following form
 (10)
(10)
where h1k and h2k are the components of eigenvectors
corresponding to two largest eigen values of matrix ![]() (K´K). So, the nonlinear problem (9) is substituted
by the equivalent linear one (10). And four
unknown constants s11 ,...,
s22 can be determined
using the next consideration.
(K´K). So, the nonlinear problem (9) is substituted
by the equivalent linear one (10). And four
unknown constants s11 ,...,
s22 can be determined
using the next consideration.
From physical
point of view, as distances between the reader and tags vary in the range exceeding
several wavelength of the reference signal and frequency tolerance of the tags
is high, one can assume that distribution of the measuring phases jk (k=1,...,K) is uniform in the
segment [0,2π]. In case of
accurate estimates of the phases (constants s11
,..., s22 are determined
correctly), their distribution got from expression ![]() is uniform either.
is uniform either.
Let us
suppose that incorrect estimators of constants s11 ,..., s22
differing from their true values are found.
Then calculation of parameters' estimates ![]() and
and ![]() from (10) will be
equivalent to some linear transformation of the true values
from (10) will be
equivalent to some linear transformation of the true values ![]() , and the distribution of phase estimates
, and the distribution of phase estimates ![]() will differ of uniform one. Hence, if we evaluate this distribution (e.g. with the help of the
frequency diagram of the phase estimates dividing the whole segment [0,2π]
into r bins) then it should be compared with the universal one and some correction
factors for constants s11
,..., s22 could be calculated.
will differ of uniform one. Hence, if we evaluate this distribution (e.g. with the help of the
frequency diagram of the phase estimates dividing the whole segment [0,2π]
into r bins) then it should be compared with the universal one and some correction
factors for constants s11
,..., s22 could be calculated.
Assume that
in equation (10) s11 = s22 = 1, and s12 = s21 = 0. Then
the calculation of estimates gives ![]() , and
, and ![]() . The histogram
construction (Fig. 2) shows that the distribution of the phases
. The histogram
construction (Fig. 2) shows that the distribution of the phases ![]() differs of
uniform. That is why, the correction
factors is to be calculated from the expressions:
differs of
uniform. That is why, the correction
factors is to be calculated from the expressions:
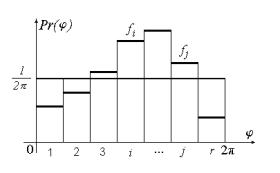
Fig.2.
Histogram of the phase estimates.
 (11)
(11)
where fj and fi
are relative rate of ![]() entering any two bins i and j from
the set of r bins [5]. Subsequently, the
estimates of
entering any two bins i and j from
the set of r bins [5]. Subsequently, the
estimates of ![]() can be found as
can be found as
 , (12)
and finally
 (13)
(13)
Thus, it
becomes possible to measure the phase sequence coming from the tag without
precise calibration of the multi-port reflectometer.
Fig. 3
demonstrates the simulation results of phase measuring with the multi-port
technique and assures the effectiveness of the proposed
approach, since the required amount of precise instrumentation can be reduced
drastically.
Fig.
3. – Real phases (dashed line) and their estimates (solid line) – as function
of discrete time.
REFERENCES:
1. K. Finkenzeller, RFID Handbook: Fundamentals and
Applications in Contactless Smart Cards and Identification. New York: Wiley,
2003.
2. A. L'vov, A. Mouchkaev, “A New Technique for Measuring
the Scattering Parameters of Two-Port Junctions with Single Multiport
Reflectometer”. 47thARFTG Conference Digest-Spring, pp.181-187, 1996.
3. G.F. Engen, "The six-port reflectometer: An
alternative network analyzer," IEEE Trans. Microwave Theory Tech., vol.
MTT-25, pp. 1075-1080, Dec. 1977.
4. EPCTM Radio-Frequency Identity Protocols
Class-1 Generation-2 UHF RFID. Protocol for Communications at 860-960 MHz.,
ver. 1.2.0., 2008.
5. A. Muchkaev, A. L’vov, N. Danilov, O. Kolesnikova,
“Six-port calibration in the RFID reader receiver,” in Proc. 24-th Int. Confer. Math.Methods in Engin.&Tech., Saratov,
Kiev, Penza, Apr.-Sep., 2011.(in Russian)
6. A. L'vov, K. Semenov. “A Statistical Calibration
Technique of the Automated Multi-probe Transmission Line Reflectometer,” in Proc. of the 10th Int. Confer. "Systems
for Automation of Engineering and Research", September 27- 29, 1996,
St. Konstantin, Bulgaria, P. 38-42.