Engineering sciences/ 10
Mining
Phd in technical sciences Fattakhov Irik Galikhanovich
SEI of HPE "Ufa State Petroleum Technological University"
branch in Oktyabrsky city, Russia
DEVELOPMENT CONDITION DIAGNOSTICS ON THE EXAMPLE OF
MAY OIL FIELD
May
oil field statistical modeling [1,2] was performed for the purpose of
development condition diagnostics according to 6 main trade characteristics:
oil flow rate, tonne/month; liquid flow rate, m3/month; production
water cutting, %; liquid flow rate in sheeted conditions, m3/month;
the volume of pumped water, m3/month; ensuring selection of liquid withinjection,
% [3].
Two
periods of field development were considered for comparison: 2003-2006 – on a
field it wasn't carried out cyclic flooding (in 2005 there was one trial
delivery well) and 2007-2011 – cyclic flooding was carried out according to the
following scheme: from May to September all delivery wells were disconnected,
and from October to April all functioned. For both cases fluctuation
coefficients φ [4,5], works of system of development showing stability on the example
of flooding were calculated. When studying a field it is received for each of
two periods on 16 comparative charts with rated data. Each diagram shows
certain groups of considered parameters. Because of limitation of work volume
from all selection consisting of 32 charts, we will bring only four,
representing the greatest interest from the point of view of their
interpretation.
The
received φ values in all respects for the Mayskiy field during the first
and second periods are shown in table 1. As appears from [4,5] the lesser
fluctuation, the more process is stable. The greatest interest from regulation
point of view represents water cutting of extracted B production and Qinj
volume of injected water. After introduction of non-stationary flooding watter
cutting coefficient φ increased a little and water injection coefficient
decreased. Respectively this action positively affected water cutting as a
whole, in consequence of layer work in two modes: capillary impregnation and
filtration on channels. In turn the coefficient φ went down for injection,
because of duration and an inequality of two half-cycles in a year. The
explanation of that is covered in risk of freezing of delivery wells mouth
during the winter period, because of constantly low temperatures around a
field. Therefore regulation of non-stationary flooding with use of measures for
the mouth freezing prevention of delivery wells [6,7] for elimination of
interruptions in its work that will cause increase φ and according to
stability of work is necessary.
Table 1 – Values of coefficient of
fluctuation φ for the May field during the first and second periods
|
|
Qo |
Ql |
B |
Qll |
Qinj |
Qinj/Qll |
|
First period |
4,36 |
3,85 |
1,81 |
3,93 |
3,35 |
6,26 |
|
Second period |
3,41 |
6,06 |
2,85 |
6,20 |
1,16 |
11,69 |
Let's
consider figures 1 and 2 where in both cases to winter decrease in pumping Qinj
water there corresponds also reduction of oil production of Qoil
that is peculiar to all to years of development. This regularity has directly
proportional character. Schedules of figures 3 and 4 show that the increase in
water cutting of B is at the bottom of reduction of amount of extracted Qн oil,
i.e. dependence is inversely proportional. For this reason planning [8] and carrying
out water insulating works [9] in extracting wells with the greatest
fluctuations of parameter of water cutting is necessary.
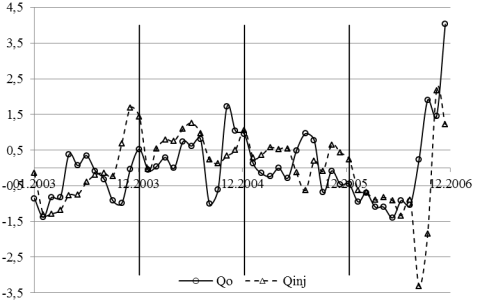
Figure 1 – Schedules of rated indicators on oil production of Qoil
and volume of pumped Qinj water
during the first period (abscissa axis corresponds to monthly changes)
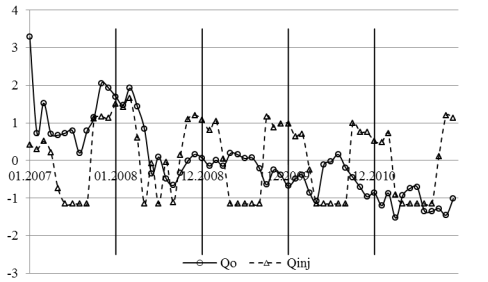
Figure 2 – Schedules of rated indicators on oil production of Qoil
and volume of pumped Qinj water during the second period
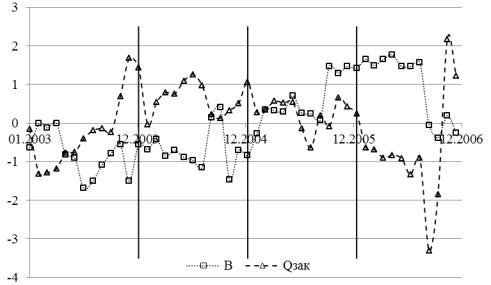
Figure 3 – Schedules of
rated indicators on water cutting of extracted production of B and volume of
pumped Qinj water during the first period
It
is necessary to emphasize importance of increase of coefficient of fluctuation
on the example of table 2 with data of the missed oil production in a year
during the first and second periods. Losses of oil were counted on the basis of
data during stable work of non-stationary downloading. Let's note that the
annual missed production is considered only for other period of year (not
entering into the period of stable work).
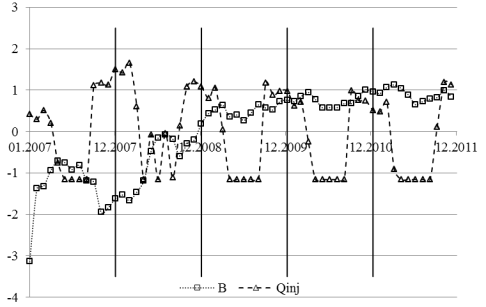
Figure 4 – Schedules of
rated indicators on water cutting of got production of B and volume of pumped Qinj water
during the second period.
From
the above-stated data follows that during the first period because of
instability of process of flooding the enterprise lost about 5 thousand tons of
oil every year and about 20 thousand tons for the considered period. During the
second period of loss decreased to 1,25 thousand tons a year and for the
reporting period made about 6,5 thousand tons of oil. This calculations were carried
out against decrease in average outputs of the second period for 5% in
comparison with the first.
Table 2 – The missed oil production
in a year
|
Period |
Theaverage daily lost
flow rate |
The percentage from
average daily production |
Annual loss of
production |
|
Δql, t/d |
qpl, % |
Ql, t |
|
|
First |
20,28 |
11,05 |
4928,18 |
|
Second |
5,18 |
3,63 |
1257,84 |
As
the recommendation we will tell about need of increase of coefficient of
fluctuation on parameters of volume of pumped Qinj water and water
cutting of got production of B to 10. What as it was spoken earlier, requires
introduction of effective measures for the prevention of freezing of the mouth
of delivery wells. And also application of techniques of forecasting of nature
of flood and determination of expediency of carrying out water insulating works
[8] with application of new blocking structures [9].
List of reference:
1.
Mirzadzhanzade A.H., Stepanova G.S.
Matematicheskaja teorija jeksperimenta v dobyche nefti i gaza. M., «Nedra»,
1977, 229s.
2.
Kul'bak S. Teorija informativnosti i
statistiki. M., «Nauka», 1967, 408s.
3.
Promyslovye dannye OAO «NK«Rosneft'»
po Majskomu mestorozhdeniju za 2003-2011 gg.
4.
I.G. Fattakhov, R.R. Kadyrov, L.S.
Kuleshova. The investigation of non-stationary waterflood using statistical
approaches// European Science and Technology: materials of the international
research and practice conference, Vol. I. Bildungszentrum Rdk e.V. Wiesbaden,
Germany, 2012. p.182-186.
5.
I.G. Fattakhov. The consideration of
the cyclic injection through the example of Stakhanovskiy oil field//
International scientific periodical «Modern fundamental and applied
researches». 2012.- №4(7). p. 70-73.
6.
Kadyrov R.R., Fattahov I.G.,
Kuleshova L.S. Primenenie jelektroprogreva dlja preduprezhdenija zamerzanija
ust'ja nagnetatel'nyh skvazhin / //Neftepromyslovoe delo. - 2012. - №4. - S.
32-35.
7.
Fattakhov I.G. The method of
wellhead thermal insulation in injection wells / I.G. Fattakhov, R.R. Kadyrov,
L.S. Kuleshova. //Electronic scientific journal "Oil and Gas
Business", 2012, Issue 1, pp. 117-120.
8.
Fattahov I.G. Prognozirovanie
haraktera obvodnenija i celesoobraznosti provedenija vodoizoljacionnyh rabot /
R.R. Kadyrov, I.G. Fattahov, Je.R. Hamidullina, A.V. Patlaj//
Inzhener-neftjanik. - 2012. - № 3. - S. 55-60.
9.
Fattahov I.G., Kadyrov R.R.
Rezul'taty primenenija tehnologii na osnove vodnyh rastvorov aljumohlorida pri
provedenii vodoizoljacionnyh rabot //Neftepromyslovoe delo. - 2010. - №1. - S.
44-46.