Zholdybayeva
A.A., Dakenova K.T., Ahmad N.S.
The
Kazakh national medical university, Kazakhstan
Application of visual organizers in the study of human anatomy
To adapt to the continuously changing information
supersaturated environment requires a qualitatively different level of
intelligence, cognitive abilities and information culture [1,2].
Subject of the human anatomy has enormous amount of
information difficult to remember. In most cases, students are forced to cram
the whole chapters of the textbook. Repeatedly proven that such study of the
subject is ineffective even meaningless. After some time, the students are not
able to recall even a tenth of this information. In addition, such a method
leads to a complete loss of interest in the learning process, thus further
reducing the efficiency of learning [3].
The new standard of Education requires that the
student could itself pose and solve problems, understand what is learning to be
motivated, able to communicate, evaluate yourself and others, but also to
gather information, and then think about it, analyze, synthesize and organize.
One possible solution to this problem would be the
extensive use of visual organizers.
Visual organizers - a way to image the process of
thinking through schemes of thinking and visualizing the organization of
textual information.
Visual organizers such as time lines, Venn diagrams,
concept maps, mind maps, argument maps, causal chains, force fields and process
diagrams to help you better understand and manage the intellectual processes.
Visual organizers reflect semantic scheme, they allow
to master the skills of higher order thinking without prejudice to the
understanding of the contents of a particular field of knowledge [4,5].
Graphics frames can very effectively be used when
working with text (reading and writing), and in the perception of speech and
debate. They make cognitive processes more intense and focused.
Using a concept map depicting imitating, hierarchical
structure helps to make clear and maximize deductive way of thinking, the only
available person.
Proved that graphic organizers are stepping up
awareness and contribute to a more skillful (critical) thinking of any person,
regardless of the level and nature of education.
Using visual organizers allows students
to strengthen reading comprehension to understand the topic, the problem with
different levels of knowledge and skills, organize and direct the thought
process, to promote higher order thinking, evaluate and adjust the process of
its training activities; easily write texts, draw conclusions , arguments act
in the discussions.
Teachers such work allows students
to see what they already know and can do, and, based on this, send them to the
correction of errors and difficulties to build its future work.
Visual organizers to achieve
the objective method can be divided into 2 groups:
|
"From the Ground - to the top" |
"from the top - to the Ground " |
|
Help
to scan, sort and organize information, make inferences and conclusions, thinking inductively (from private to
general.) |
Help to apply the rules to make decisions,
analyze problems and find solutions, thinking deductively (from general to
specific). |
Receptions "From the Ground - to the top" built on inductive reasoning.
Work is based on
the following algorithm:
1. Watch. Gather
the facts, strive to maximize the objectivity discarded bias and prejudice.
2. Analyze .
Classify the facts , noting similarities and differences. I try to find
patterns in the collected facts.
3. Formulate
conclusions. Make generalizations based on the detected patterns.
4. Find confirmation: I confirm my generalizations on the basis of follow-up
observations. .
The most common use for graphical visualization techniques " from the
ground - to the top" can be called:
• Tapes time - help
build events in chronological order to highlight areas, recurring events,
causes and effects, consequences of events and phenomena
• Network diagrams
- helping to link related events into one idea or concept.
• Pie charts - allow grouping of events to illustrate potentially useful
concepts and ideas.
• Information Grid, maps and graphs help calculate recurring events and bring
to a conclusion.
• Venn diagrams and complex matrix allow you to sort information on multiple
categories.
Vienna chart suitable for the lesson, during which performed comparative
characteristics of heroes works, literary movements. When reading the works of
the children find similarities and differences between the characters and
recorded in Chart Vienna. Students drawn on the scheme clearly visible
similarities and differences between the compared objects. Due to Chart Vienna
it is easy to generalize accumulated material and formulate his speech.
The
basis of imaging methods "From the top to the ground" is the method
of deduction, which teaches reason, and this is one of the main tasks of
learning in general. Education search and build evidence sent three main
issues:
1. What? A clear
statement of the problem, a problem for which we are looking for solutions and
ways to make a reasoned choice. At this stage, the hypothesis is formulated.
2. Location? From what is already known examples, facts, observations,
experience can get the necessary information? What are the sources we still
need?
3. How? The answer
to this question will allow to plan the search for solutions, new sources of
information and analysis for the theoretical knowledge gained in a practical
way.
Examples of
techniques "from the top - to the Ground":
• Conceptual maps
are used to organize information , to identify the essential features of the
phenomena being studied, events
• Causal chains
allow you to see or create a process model, such as metamorphosis in biology,
or a revolution in the history of the novel.
• Fishboun helps to
structure the process, identify possible causes of the problem (hence another
name - the causal ( cause and effect ) diagram ( causal map )) . This type of
chart allows us to analyze the causes of events in more depth, set goals, show
the internal connections between different parts of the problem.
• Cluster allows a
systematic form to submit large amounts of information (keywords, ideas)
• Mental maps -
handy tool to display the process of thinking and structuring information in a
visual form. They can be used for "transcription" of thoughts and
ideas that are carried in the head when you think of any problem [6].
To date, the
Internet created a huge number of services, which at the time of reading, you
can build meaningful charts, diagrams, clusters, etc. Students looked up charts
and diagrams in the online mode.
Students come to
the department of anatomy in the first year and begin to study with the simplest
- bones. At this stage, we also use the most simple and intuitive graphic
organizer, known under the name of the concept map. As an example, the concept
map of the bones of the human body (Fig. 1) .
Figure 1 - The concept map
"Bones of the human body"
In
the future, going to study the connections of bones we can complicate
the map (Fig. 2)
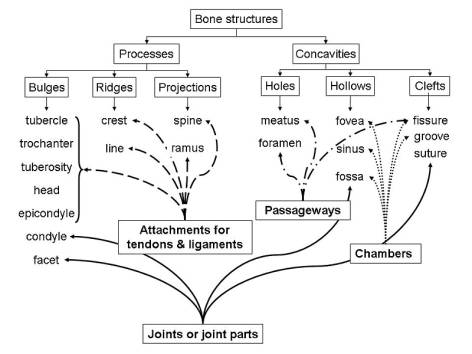
Figure 2 - concept map
"Relationship between structure and
function of anatomical formations
of bones"
Assessing of
students constructed maps based on several parameters such as the number of
concepts, vision ties linking the use of lines, hierarchical structure, and use
of examples, of course, reliability. You can use the comparison map prepared
teacher and student.
Number dialed
points - for each concept and the correct relationship is given one point, more
points can be given for the use of hierarchical structure and connecting lines.
From our experience
with the use of visual organizers in the study of human anatomy, we can
conclude that in the process of building visual organizers to learn educational
material student masters the skills of search and extract the necessary
information; modeling, the ability to structure knowledge, semantic reading
comprehension as reading goal and choose the type of reading depending on the
purpose; extract the necessary information from texts listened; determine
primary and secondary information, analysis objects for feature extraction
(material , immaterial) synthesis as the compilation of the whole of the parts,
including self- constructing additions, filling the missing components,
selection of bases and criteria for comparison, object classification,
establishing causal relationships, evidence.
At the same time,
the student improves their communication skills - fully and accurately express
their thoughts into dialogue, works effectively in a pair or group.
Do teachers an
opportunity to see what students already know and relate to those moments in
which they already understand. If the graphic organizers are introduced in the
form of learning strategies, they let teachers to correct errors before the
students do in their exam answers. Summarizing assessment, teachers can use
graphics as test questions, leaving a portion of blank or fragmented giving
information to the students organized it in graphical form.
Visual organizers
eliminate many difficulties in teaching students. They give to students and
teachers an effective method of presenting ideas and relationships.
Literature
1.
Clarke, J H. (2010). Patterns of thinking:
Integrating learning skills with content teaching. Boston: Allyn &
Bacon.
2.
Tulving, E. (2007). Elements of
episodic memory. Oxford: Oxford University Press. (:534)
3.
Jones, B.F., Pierce, J., & Hunter. B. (1989). Teaching students to
construct graphic representations. Educational
Leadership. 46(4), 21-25.
4.
Mayer, R. (1989). Models for understanding. Review of Educational Research, 59(1). 43-64.
5.
McKeachie, W. (1984). Spacial strategies: Critique and educational
implications. In C.F. Holley & D.F. Oansereau (Eds.). Spacial learning strategies: Techniques,
applications and related issues. Orlando. Ft: Academic Press.
6.
John H. Clarke. Using
visual organizers to focus on thinking. Journal
of Reading, 34:7, April 1991, pp. 526-534.